Global Affordability Index Analysis
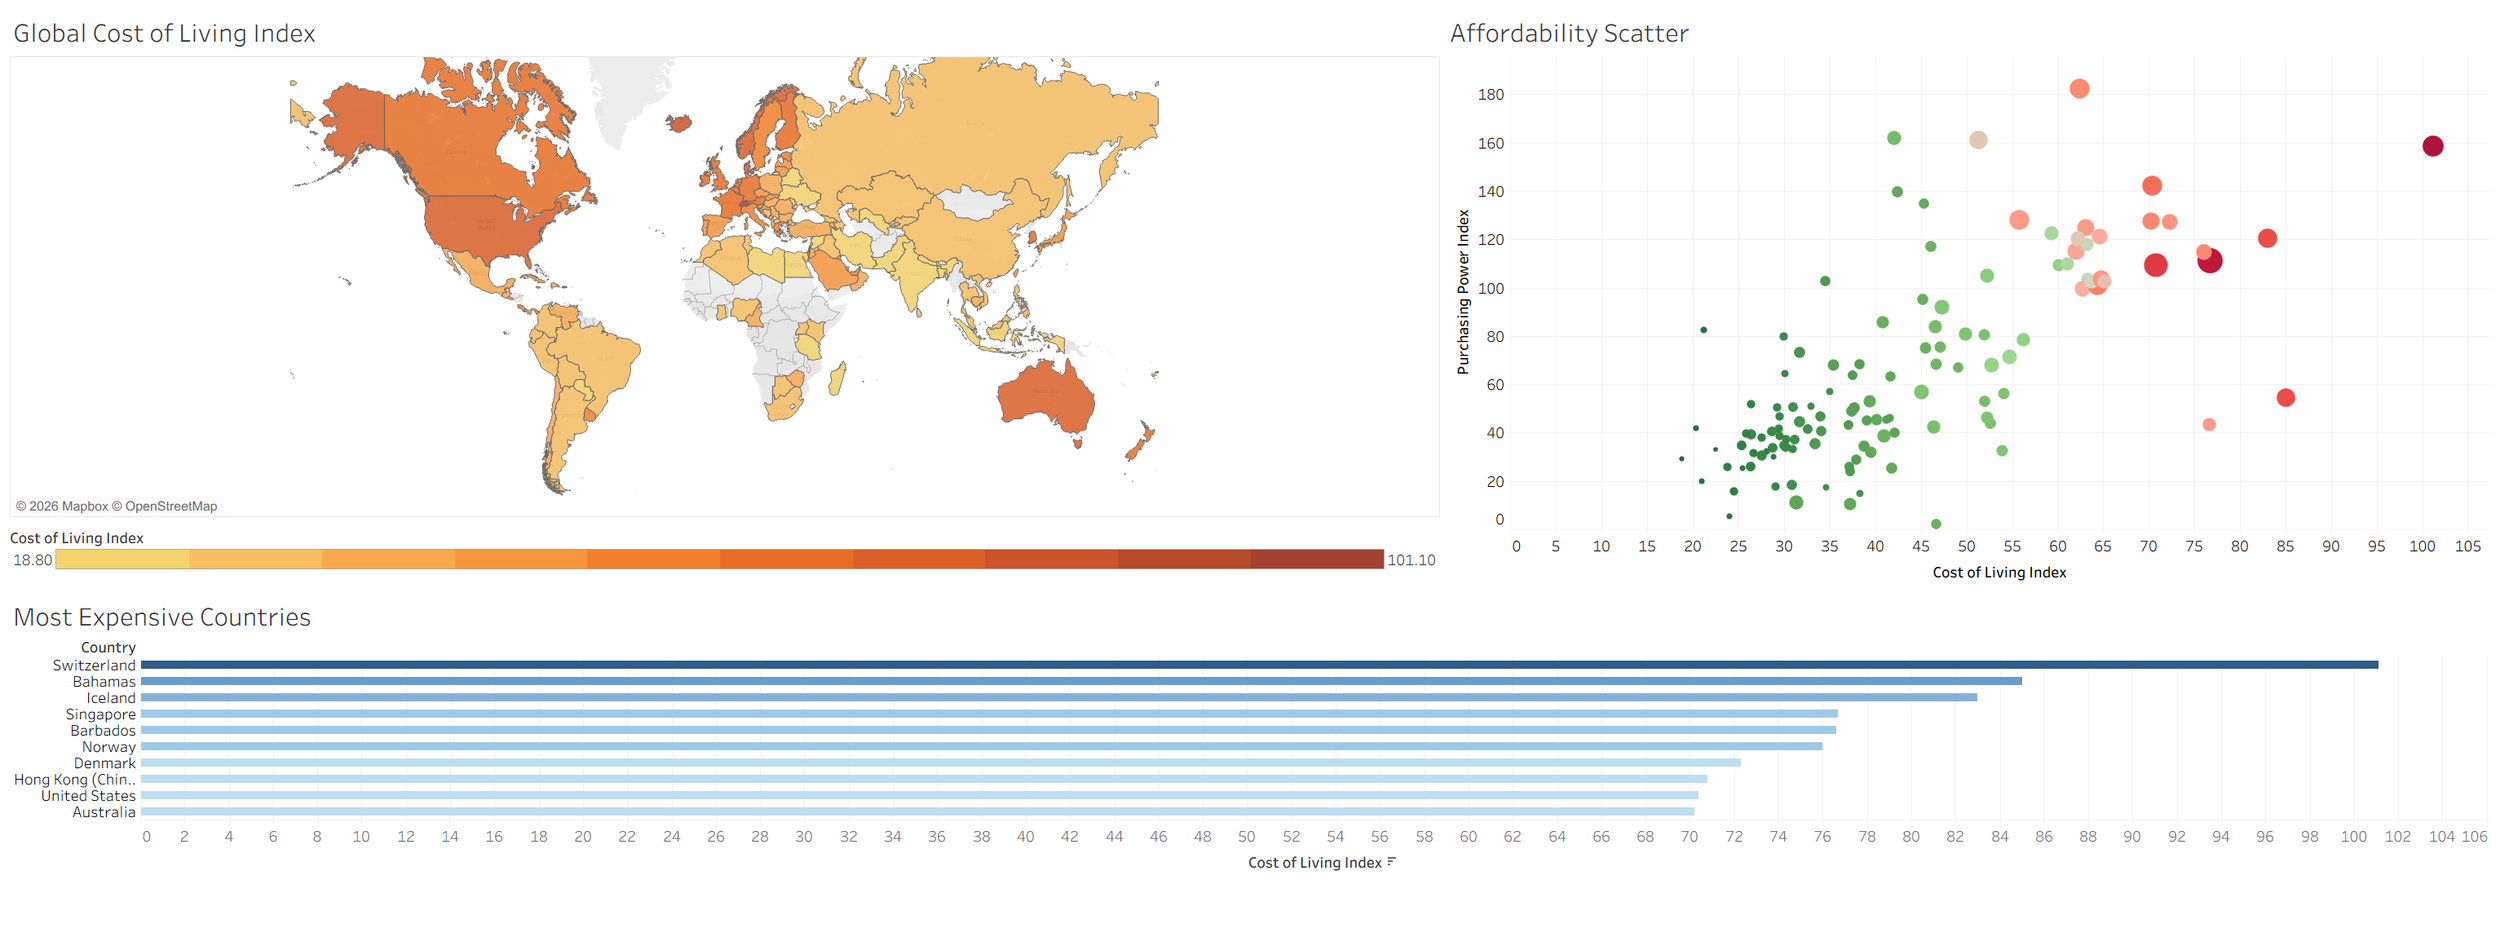
This Tableau project explores differences in affordability across countries using economic and cost-of-living data compiled from publicly available sources. The dashboard combines geographic mapping, country rankings, regional comparisons, and GDP analysis to examine how affordability varies across the world.
Tableau • Data Cleaning • Data Visualization • Economic Analysis
About the Data
The analysis uses a dataset of 121 countries containing comparative indices for cost of living, rent, groceries, restaurant prices, and local purchasing power. The underlying values correspond to Numbeo's 2024 Mid-Year Cost of Living Index by Country.
These values are comparative indices rather than direct measures of household expenses. They are best used to examine relative differences between countries and broad global patterns, rather than for precise economic forecasting.
Understanding the Dataset
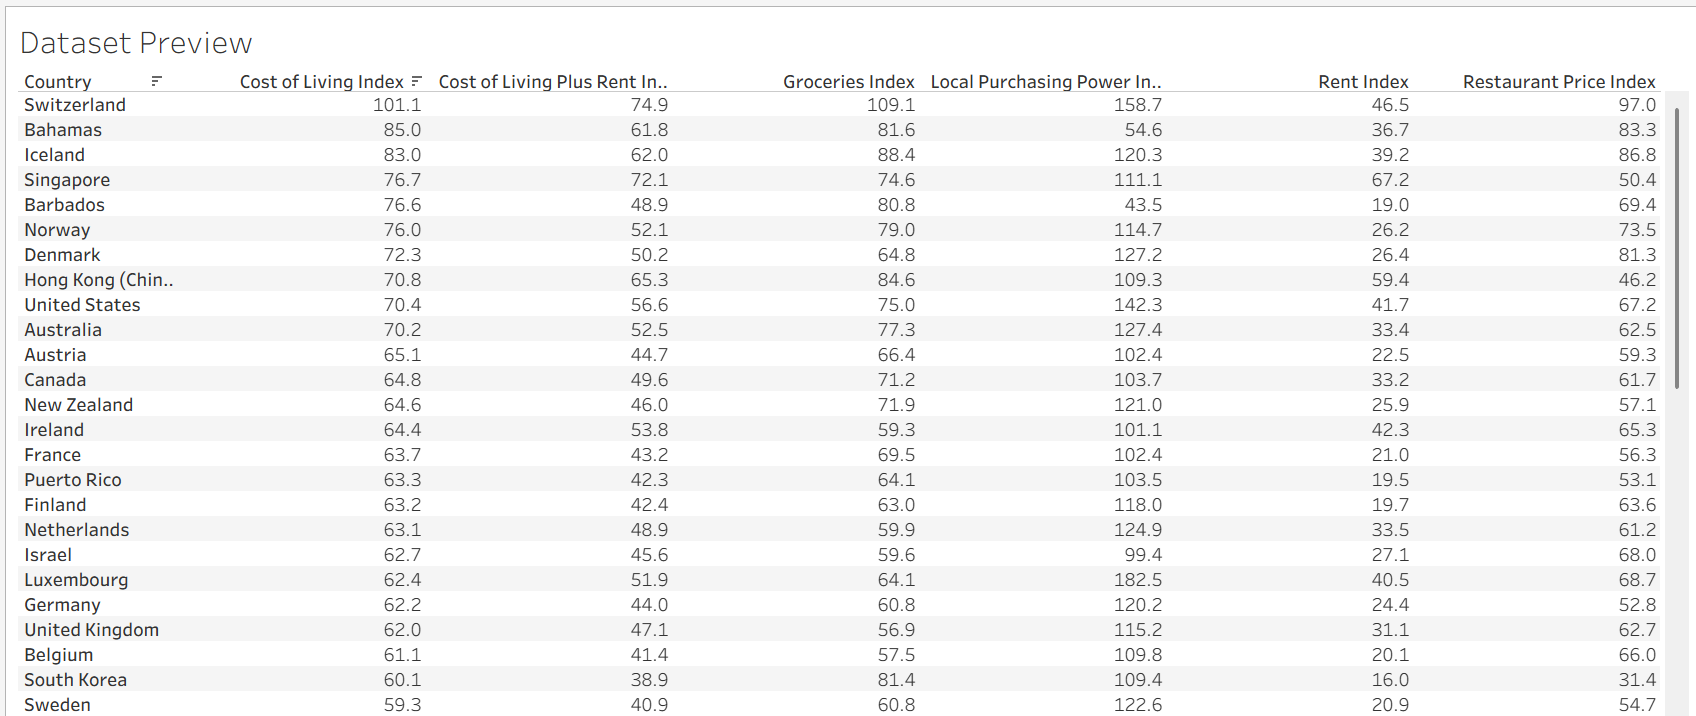
The complete dataset contains 121 countries and six comparative measures: Cost of Living, Rent, Cost of Living Plus Rent, Groceries, Restaurant Prices, and Local Purchasing Power. The table above displays the 25 countries with the highest Cost of Living Index values as a preview of the underlying dataset. These indices make it possible to compare not only how expensive countries are, but also how local purchasing power relates to those costs.
What the Data Shows
Cost alone does not tell the full story of affordability. Several countries with relatively high living costs also have strong local purchasing power, while some lower-cost countries have considerably less purchasing power. Comparing these measures provides a more useful view of relative affordability than looking at prices alone.
Data Limitations
The values are comparative indices and should be interpreted as relative measures rather than exact household expenses. They are useful for identifying broad patterns and comparing countries, but are not intended for precise economic forecasting or individual cost-of-living estimates.