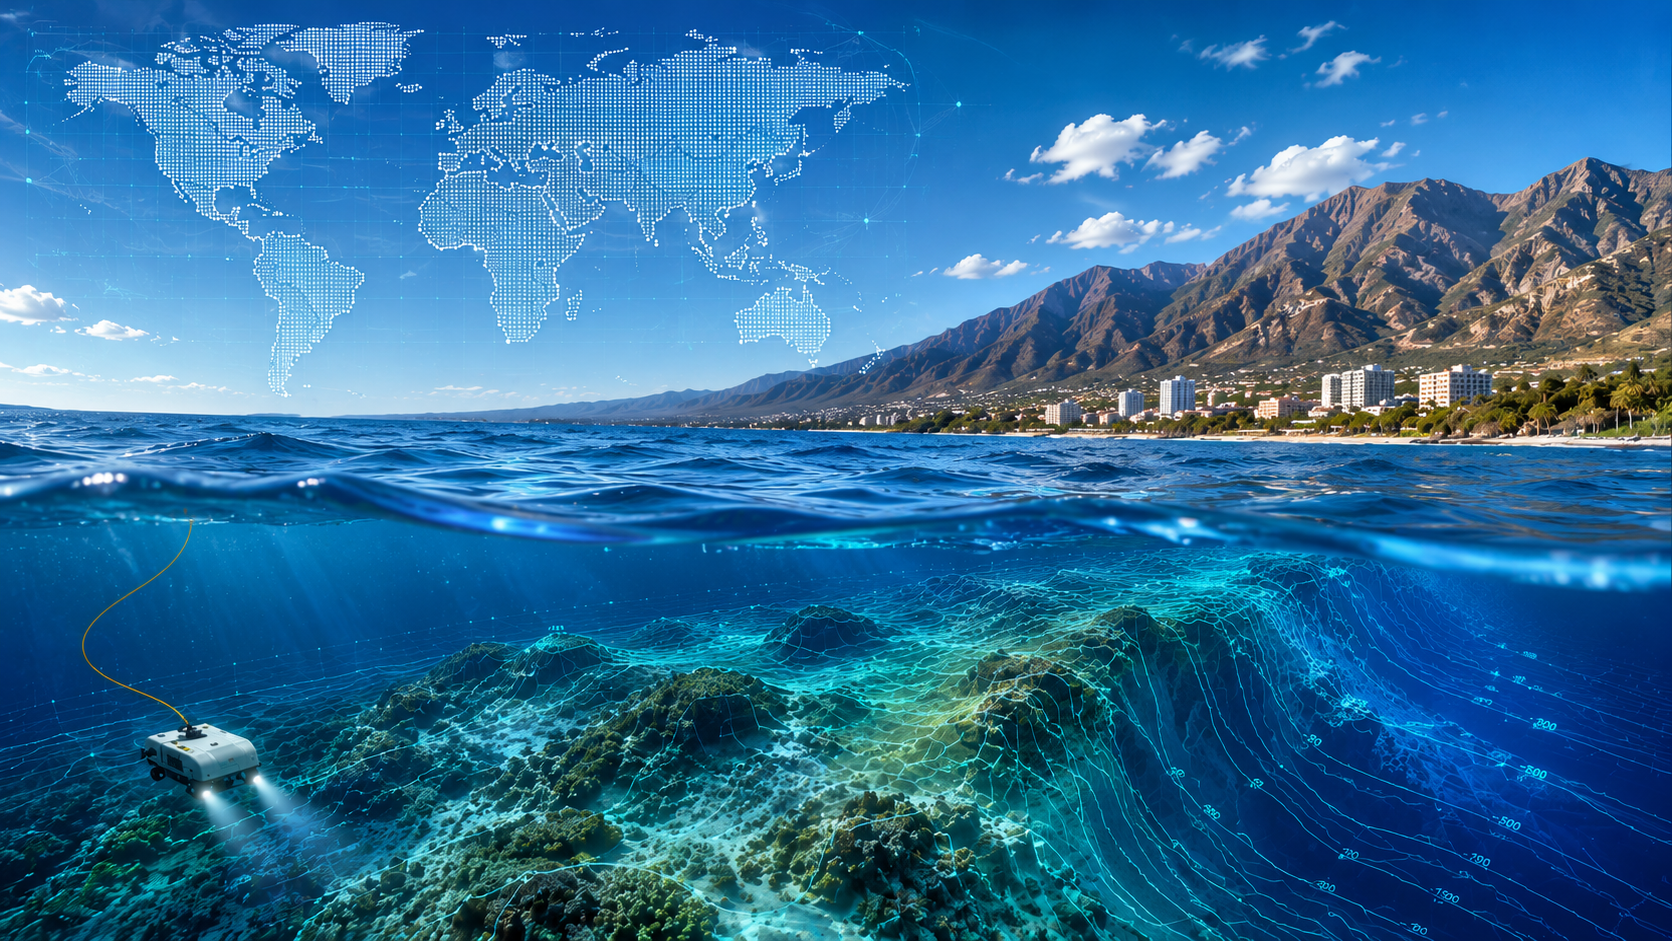
MAPPING THE WORLD THROUGH DATA
GIS • Remote Sensing • Data Visualization
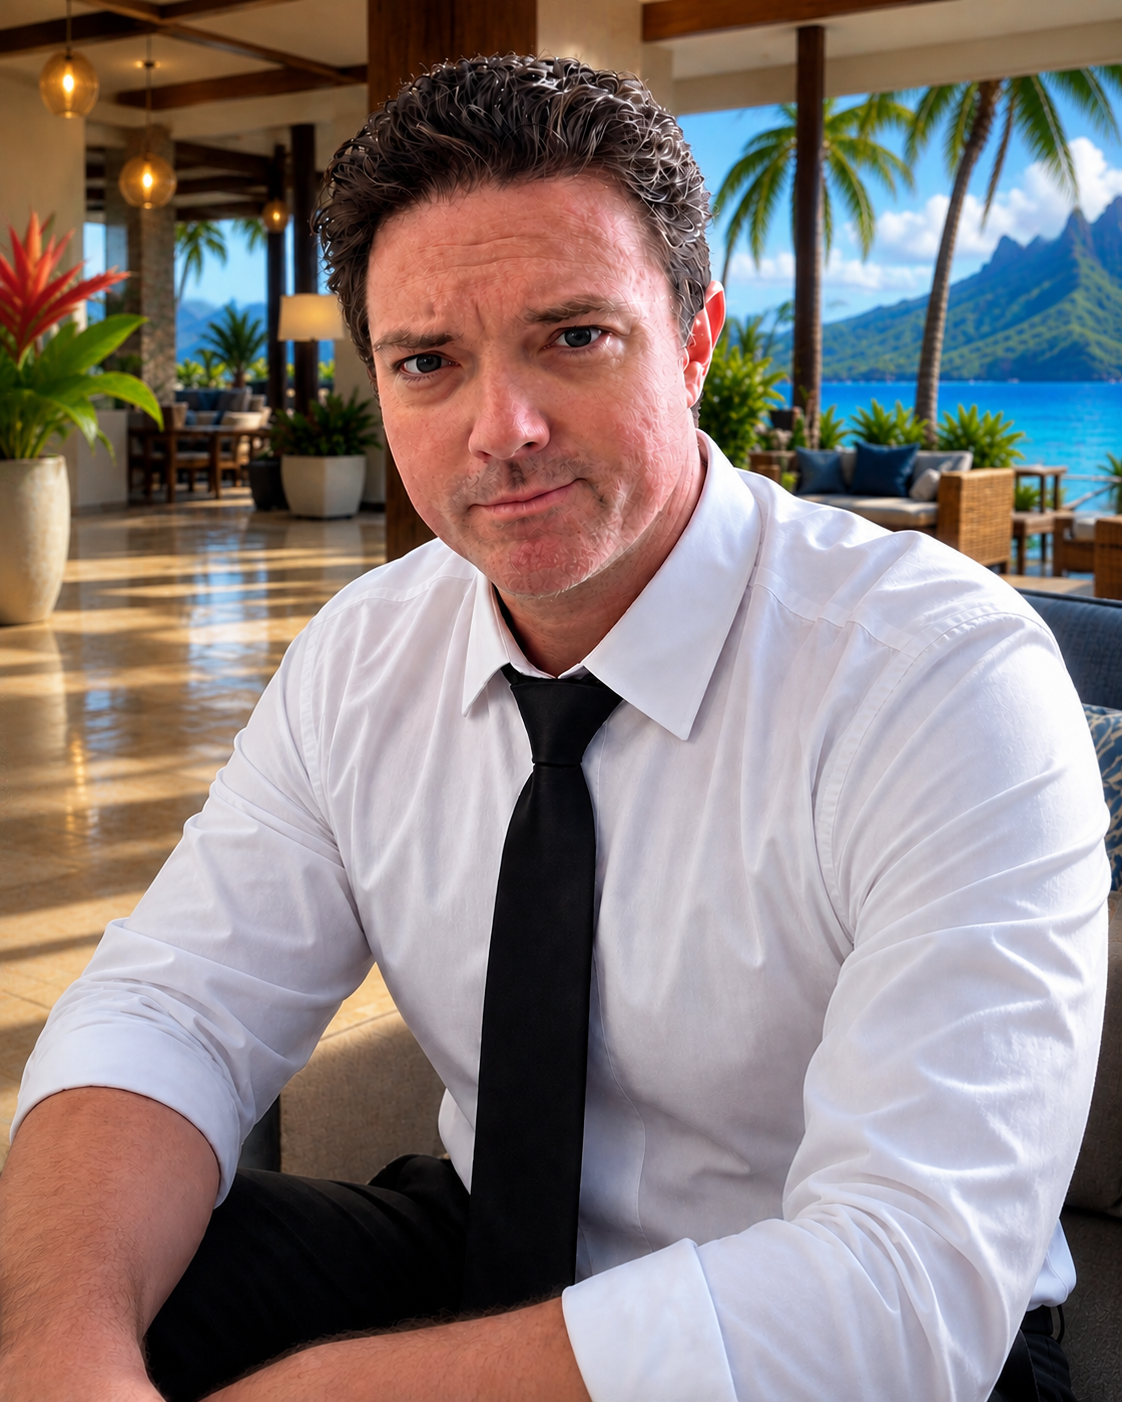
Hi, I'm Zak.
I have a Bachelor of Science in Data Science and am building a career in GIS, remote sensing, and data visualization. I enjoy exploring geographic data, analyzing satellite imagery, and creating maps that help explain patterns in the world around us.
I'm also an avid scuba diver, which has helped shape my interest in the natural environment, oceans, and the use of geospatial technology to better understand our planet. I believe that understanding our planet begins with understanding its data.
Whether studying urban environments, mapping environmental change, or building interactive dashboards, I enjoy using geospatial analysis to better understand the places we live and the environments that surround us.
I also believe that conservation and responsible stewardship of our environment are important. While data alone cannot solve every challenge, it can help us make better decisions, understand complex problems, and measure the impact of the solutions we choose.
This portfolio documents my projects as I continue developing my skills in spatial analysis, cartography, remote sensing, and geospatial data science. Each project represents an opportunity to learn something new and communicate it through maps and data.
About Me
GIS & Data Projects…
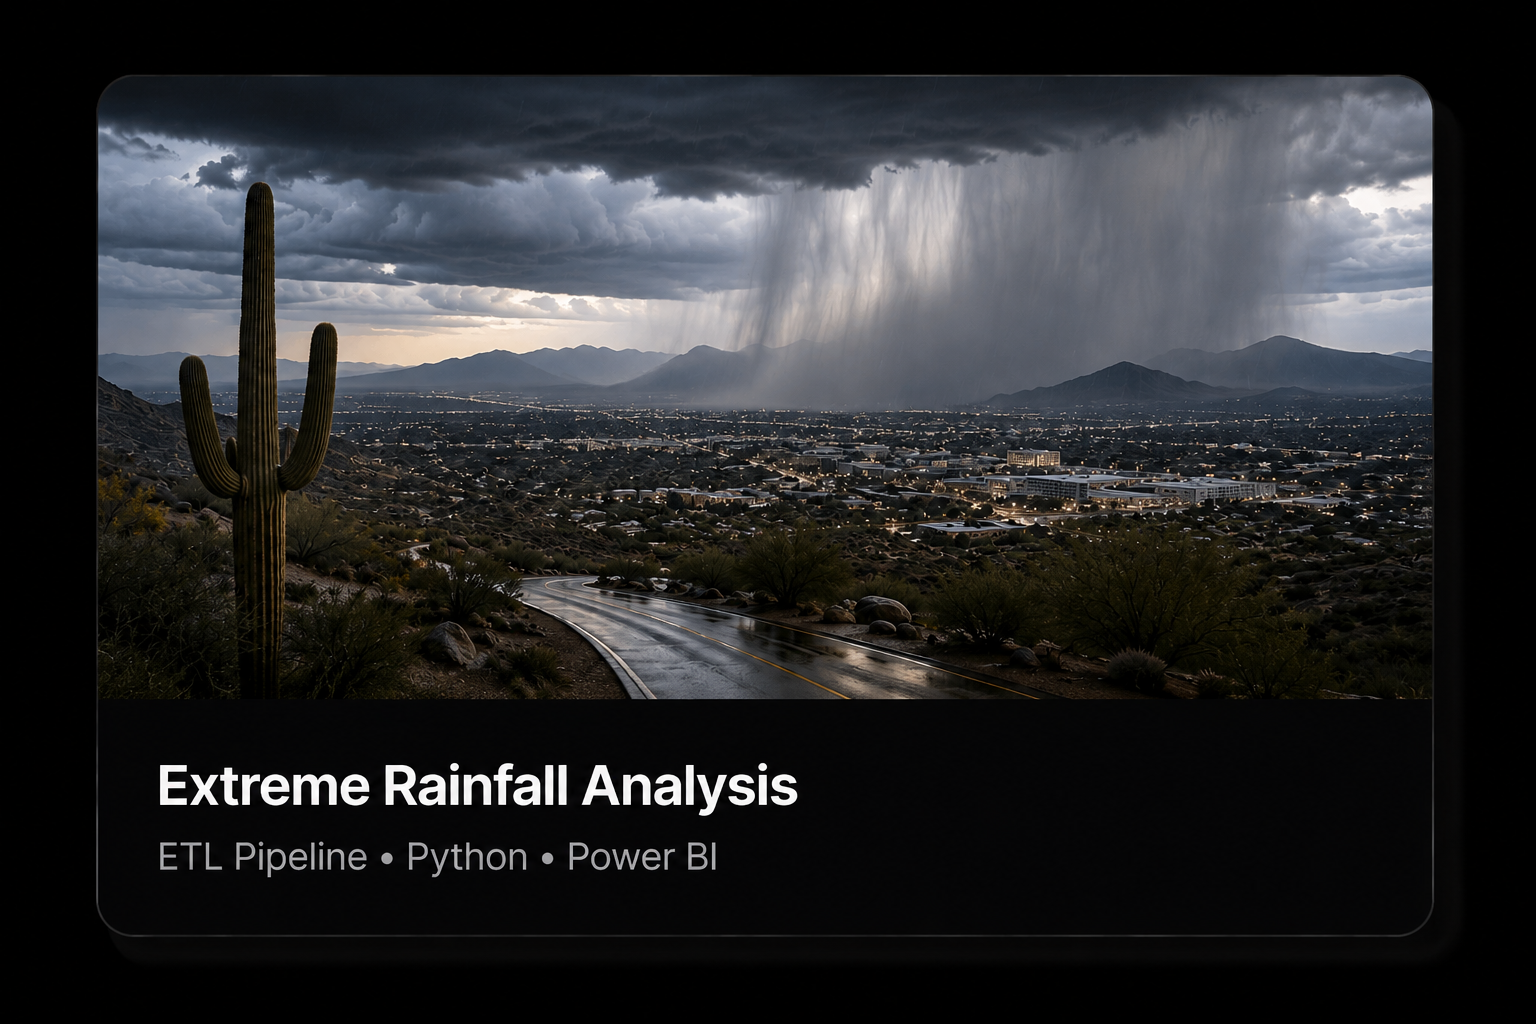
Historical rainfall analysis spanning Tucson, major U.S. cities, and global locations, supported by a Python ETL pipeline and cloud-based data workflow.
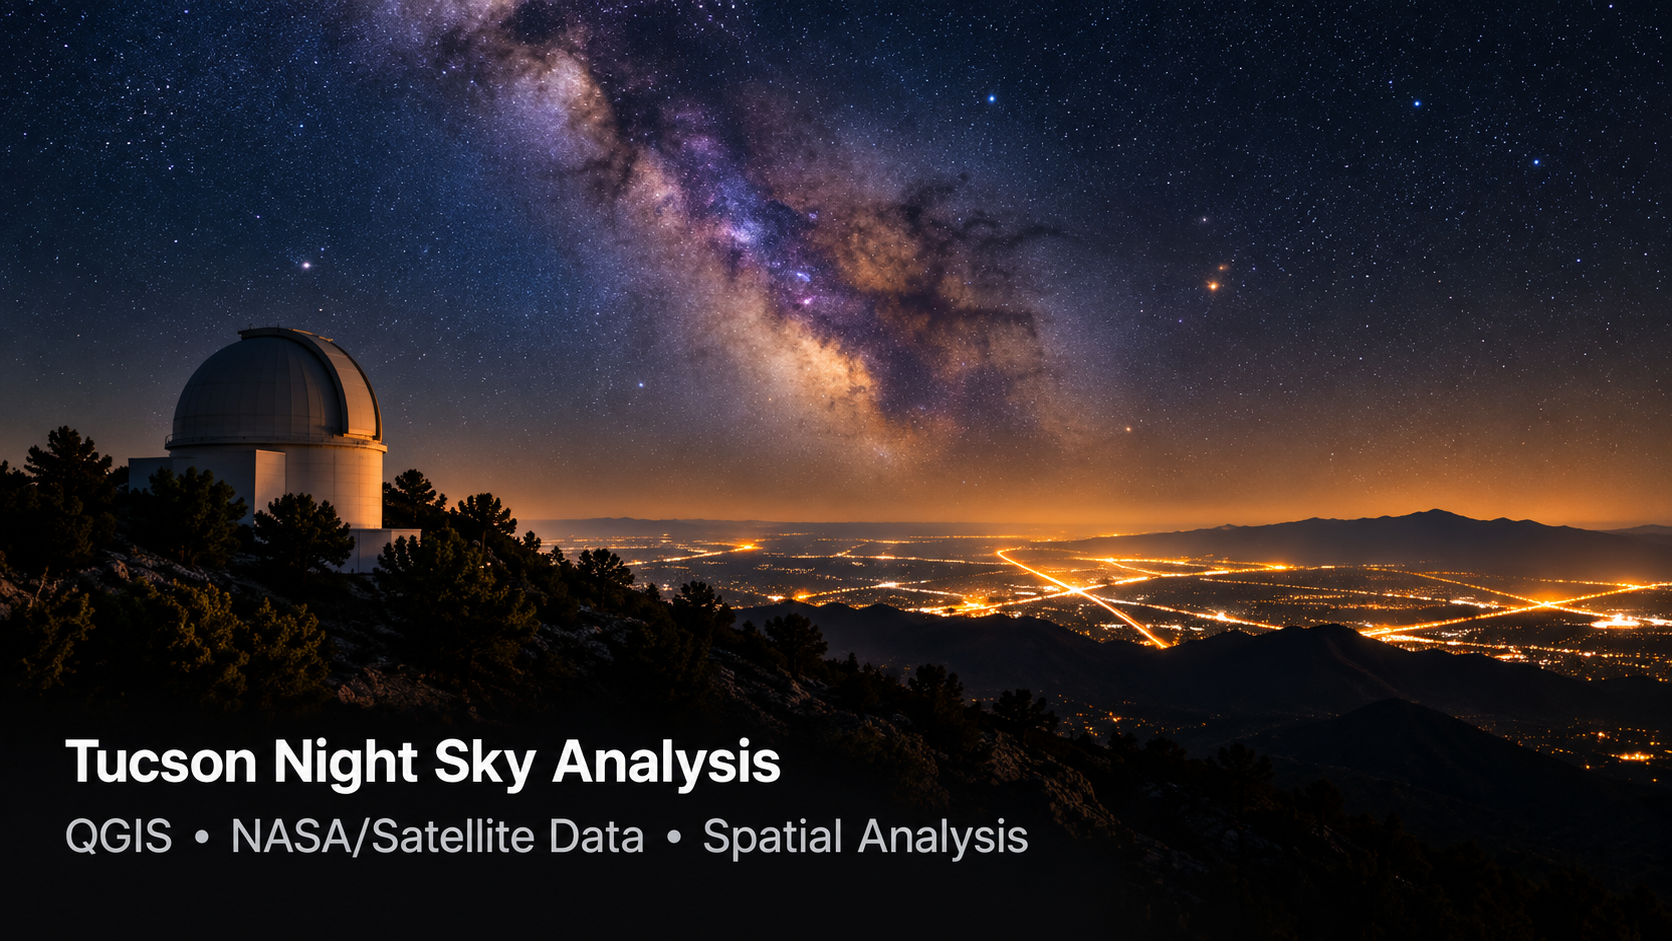
Spatial analysis comparing Tucson’s outdoor lighting zones with satellite-observed nighttime radiance to examine changes in light pollution and dark-sky conditions.
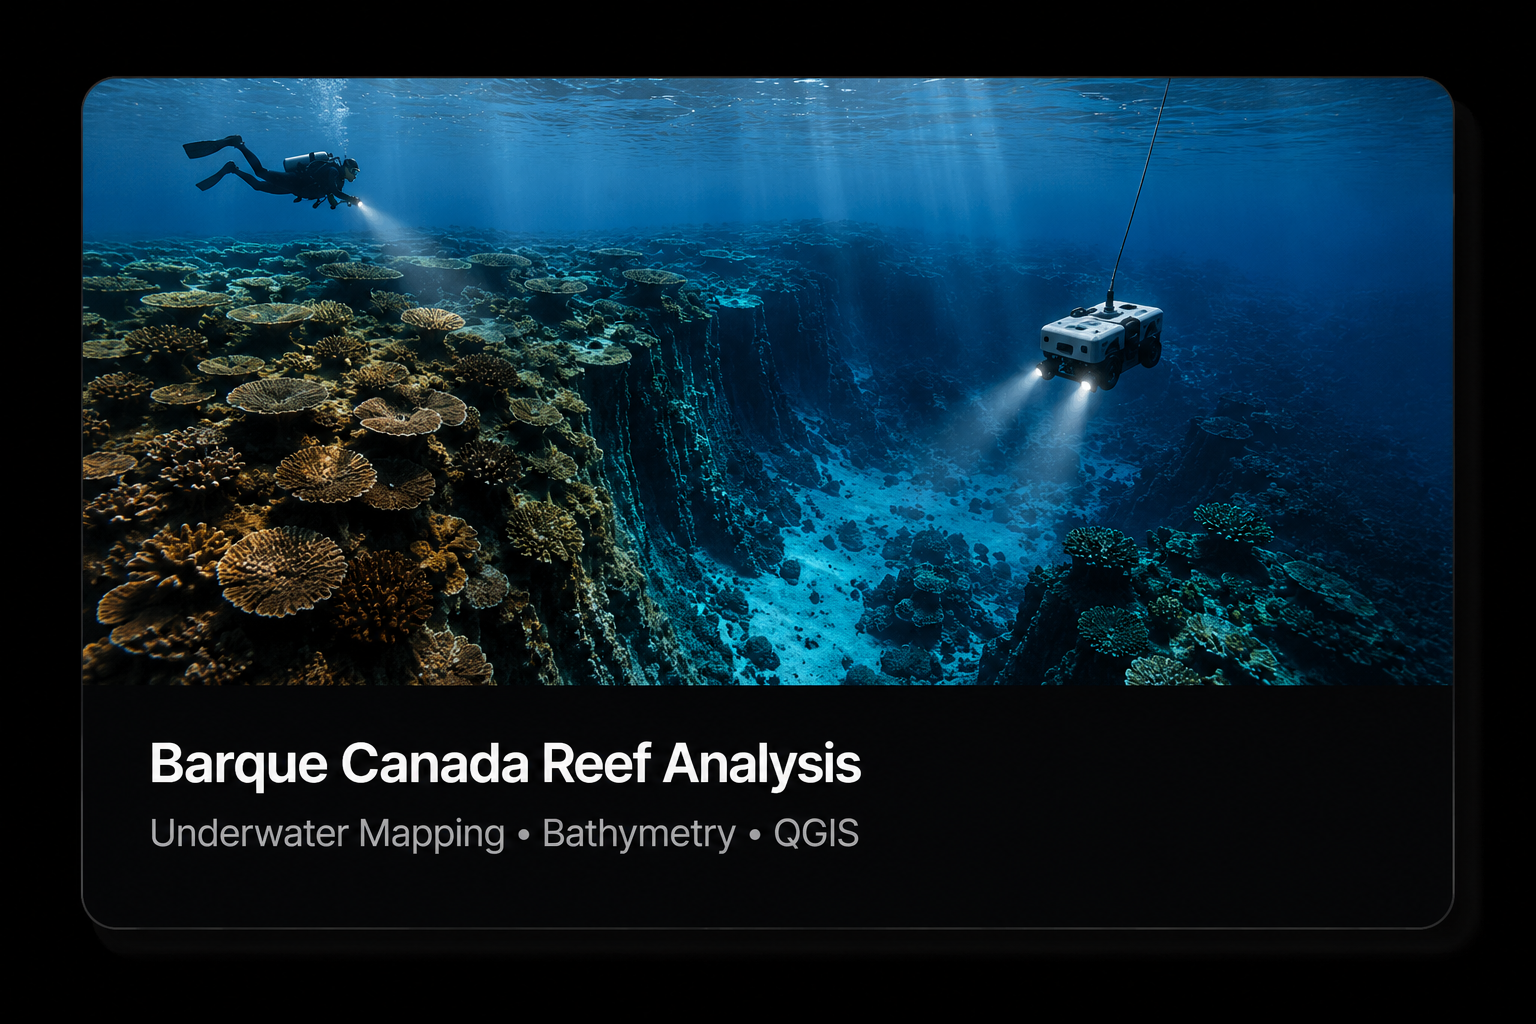
Underwater mapping project combining bathymetry, satellite imagery, and GIS to examine the geography and environmental setting of a remote South China Sea reef.
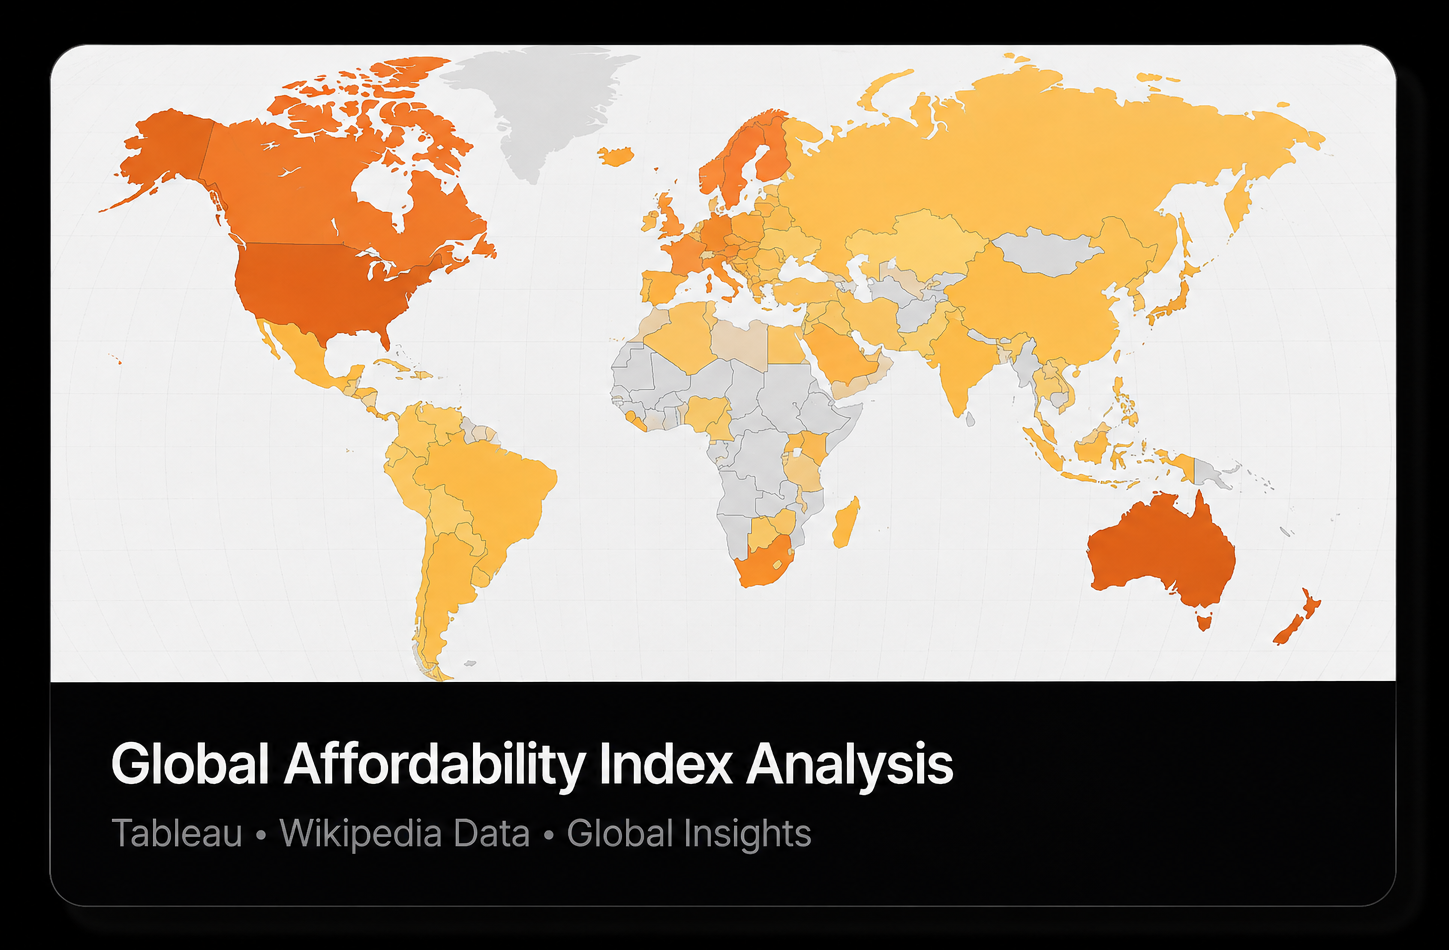
This is an aggregated affordability index dataset used for comparative analysis across countries. It’s suitable for trend and relative comparisons, not precise economic forecasting.
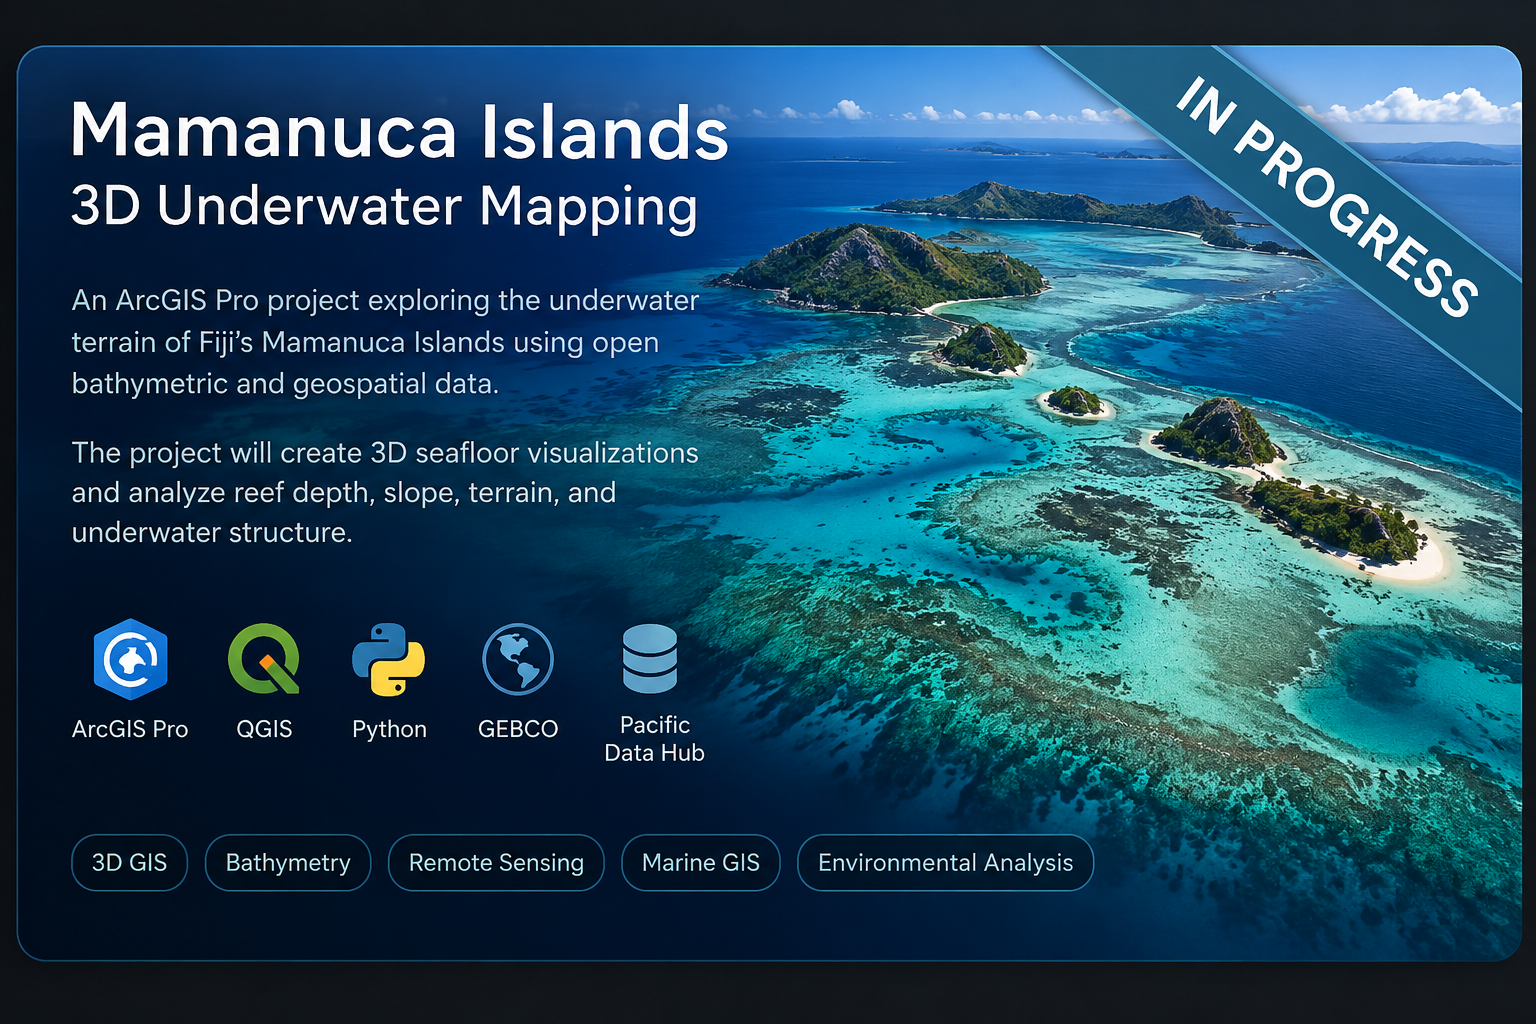
3D underwater mapping project using bathymetric and geospatial data to visualize and analyze reef depth, slope, seafloor terrain, and underwater structure surrounding Fiji’s Mamanuca Islands.