Tucson Dark Skies: Mapping Outdoor Lighting and Nighttime Radiance
A GIS and remote-sensing analysis of Tucson and Pima County's outdoor-lighting zones, nighttime satellite radiance, and proposed 2026 regulatory changes.
Project Question
Tucson's proximity to major astronomical observatories has made outdoor-lighting regulation an important part of regional planning. This project examines how Pima County's existing outdoor-lighting zones relate to satellite-observed nighttime radiance and explores the geographic context surrounding proposed changes to the outdoor-lighting map.
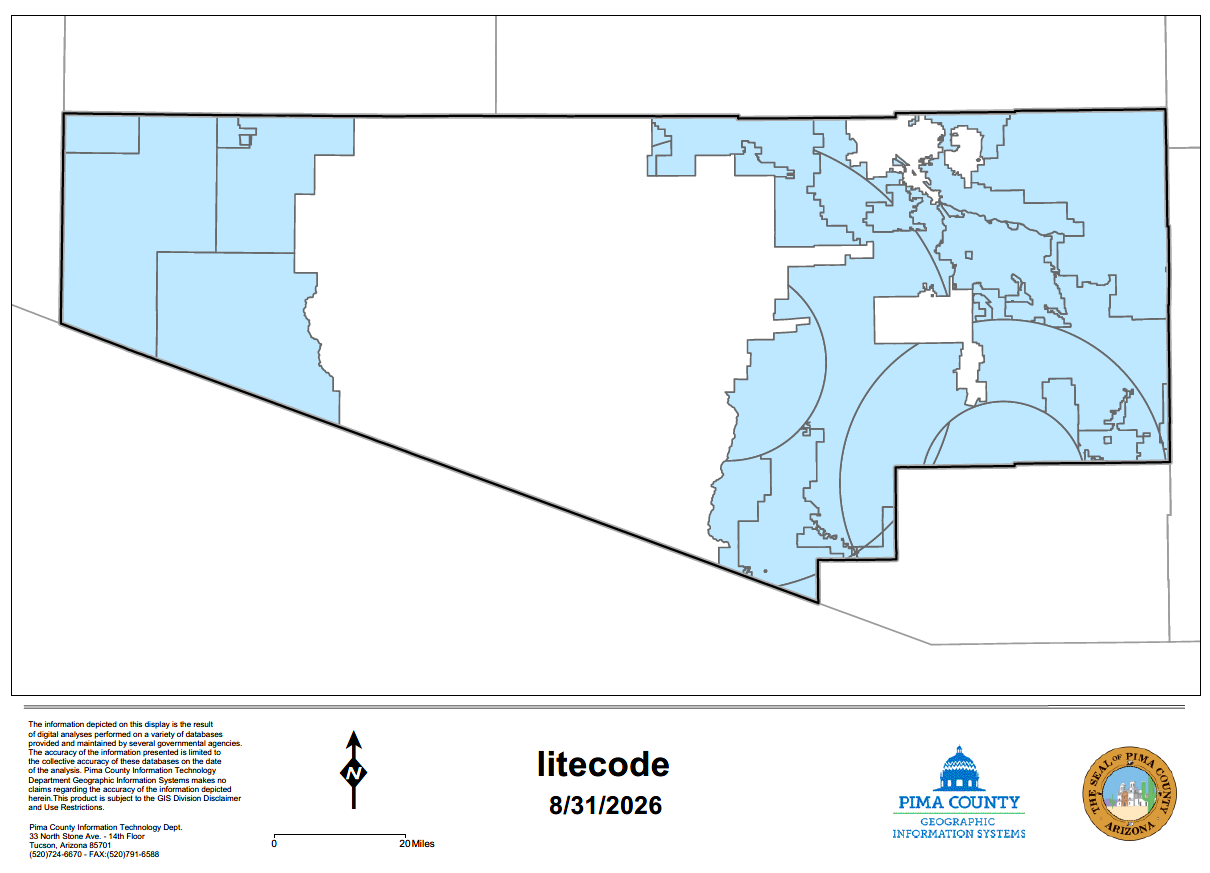
The 2012 Pima County Outdoor Lighting Code divides the region into regulatory areas with different lighting restrictions. Using Pima County's ArcGIS REST service, I imported the official lighting-code polygons into QGIS and categorized the 93 features by their LITECODE classification.
These zones provide the regulatory geography used throughout the analysis and allow satellite-observed nighttime radiance to be compared with lighting classifications.
Pima County Outdoor Lighting Zones
Proposed 2026 Lighting Map
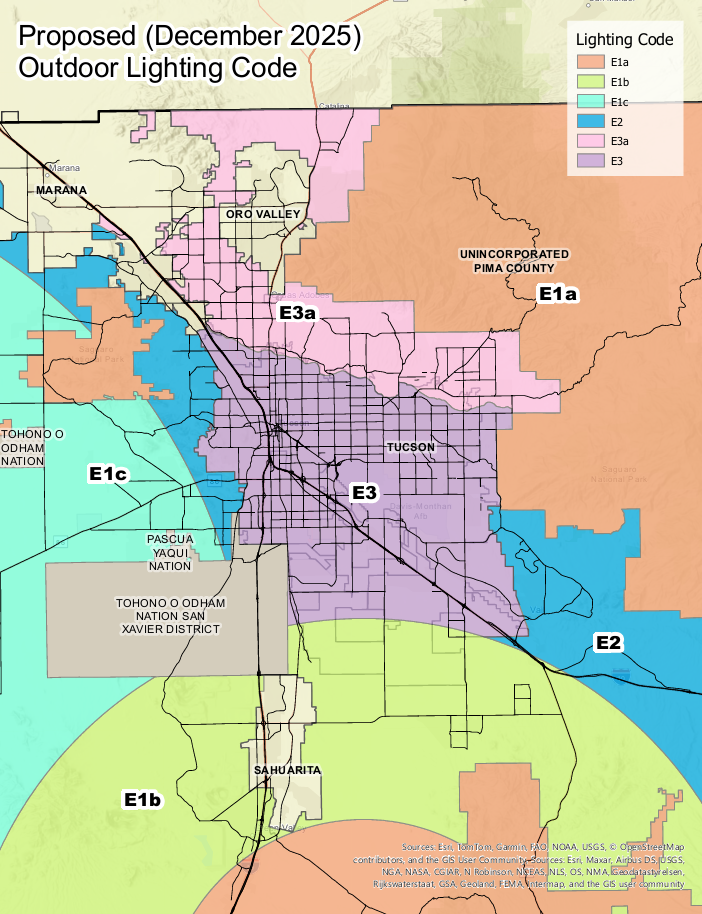
Pima County and the City of Tucson have been reviewing updates to the regional Outdoor Lighting Code, including proposed changes to the lighting-area map. Comparing the proposed geography with the existing 2012 classifications provides context for how outdoor-lighting regulation may evolve as the Tucson metropolitan area continues to develop.
Measuring Tucson's Nighttime Radiance
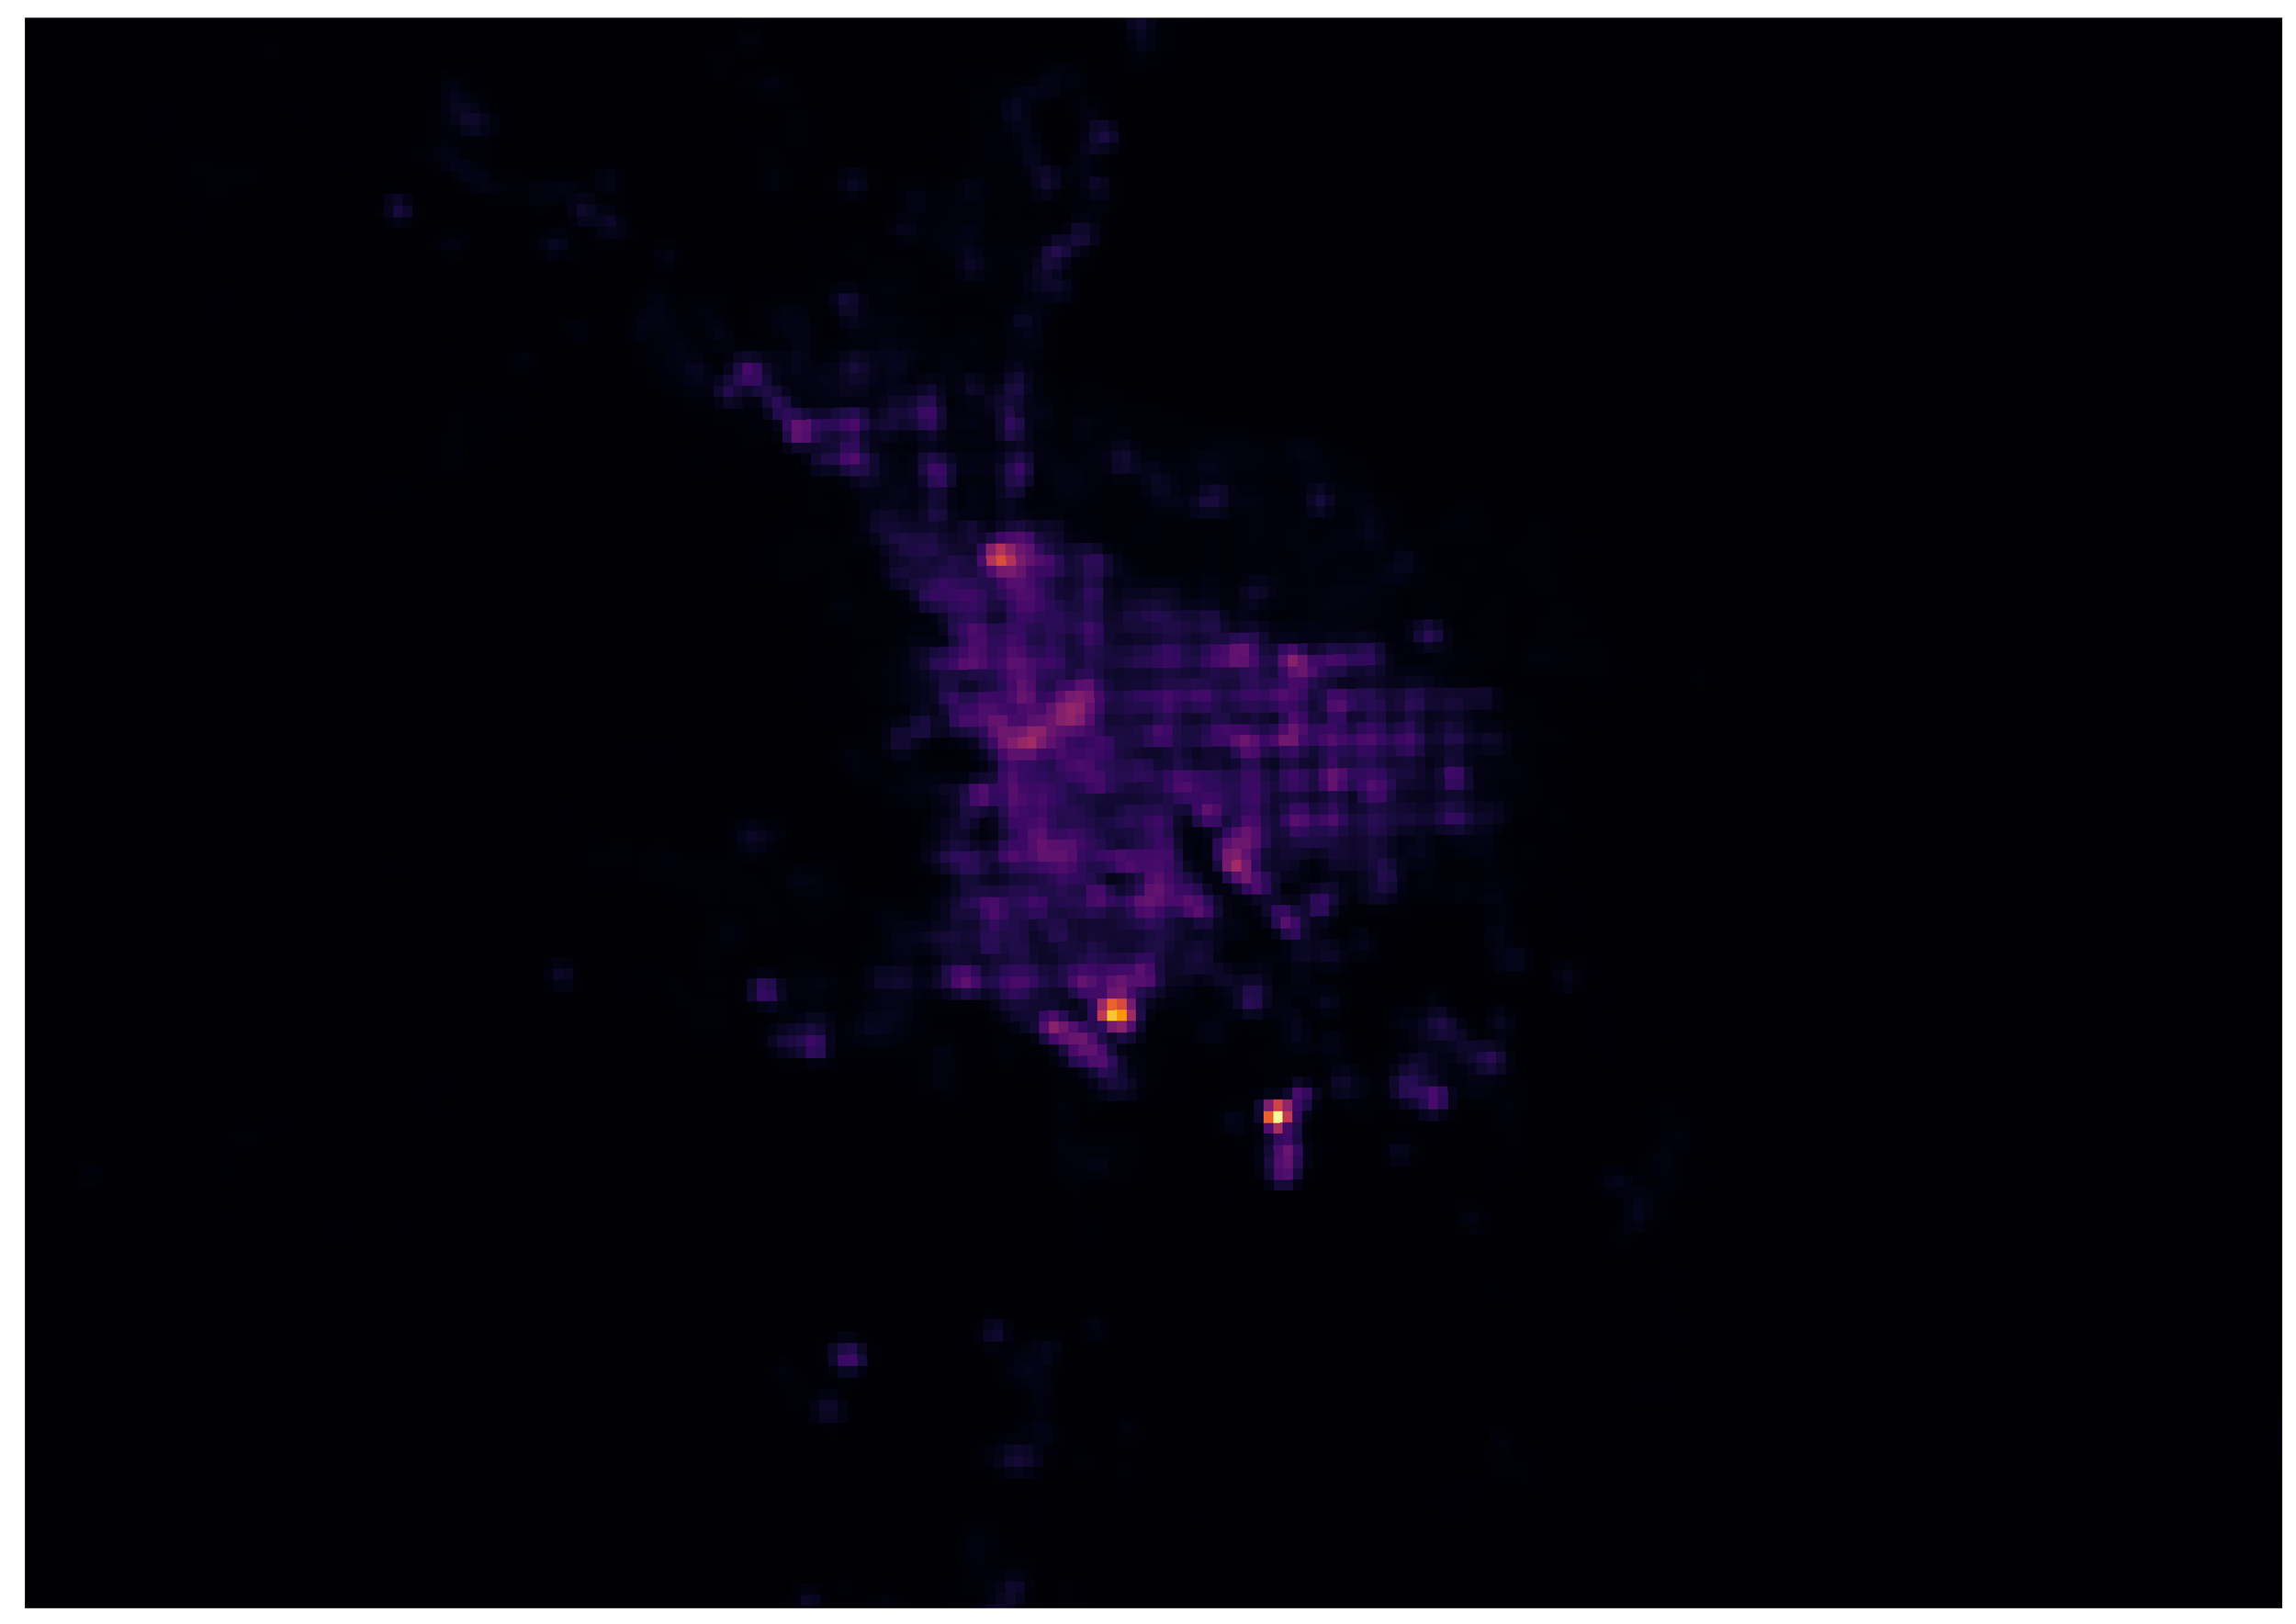
To examine observed nighttime illumination, I incorporated VIIRS Day/Night Band satellite data into QGIS. VIIRS measures nighttime radiance, allowing the spatial distribution of artificial light to be compared across the Tucson region and between different years. (The Visible Infrared Imaging Radiometer Suite (VIIRS) is a satellite-based sensor that takes detailed pictures and measurements of the Earth's land, oceans, atmosphere, and ice.)
2012 VIIRS Nighttime Radiance
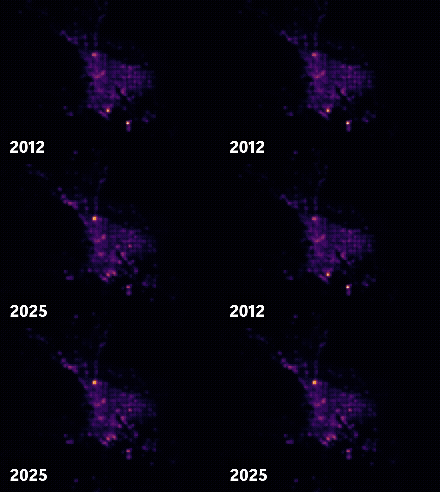
The animated comparison reveals the expansion and intensification of nighttime illumination across portions of the Tucson metropolitan area between 2012 and 2025. The visualization provides a spatial comparison rather than attributing the observed changes to any single source of outdoor lighting.
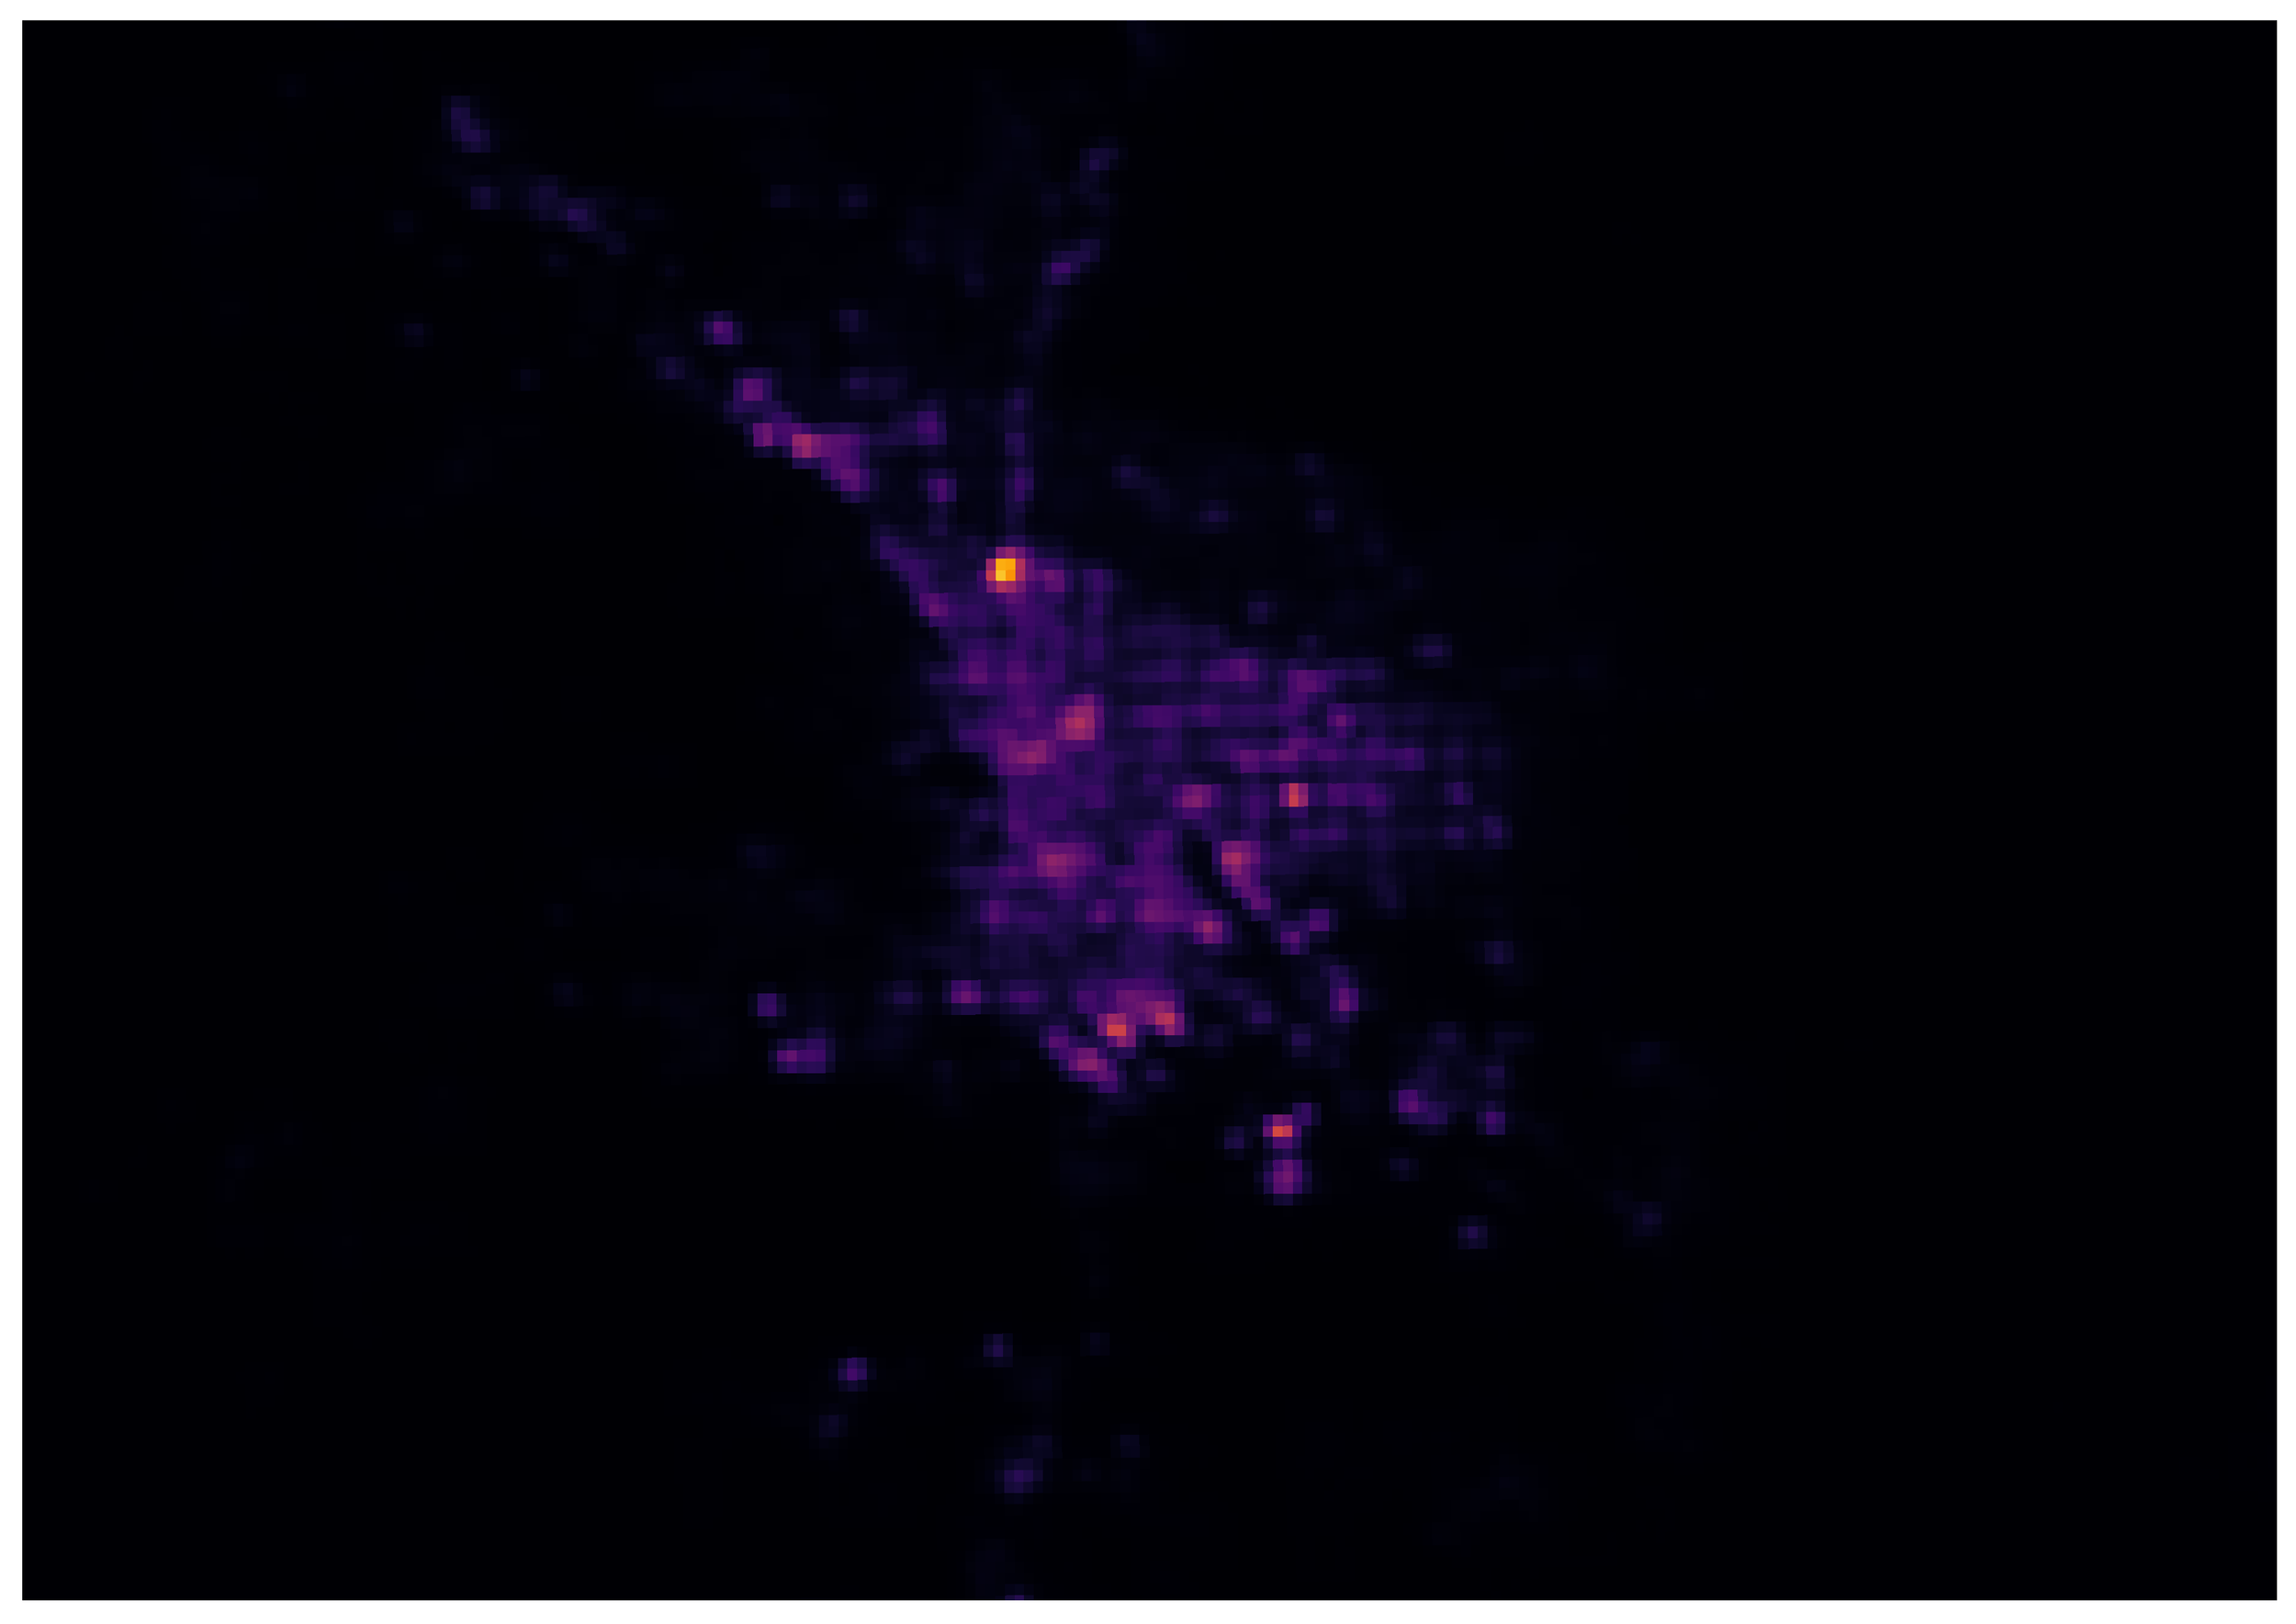
2025 VIIRS Nighttime Radiance
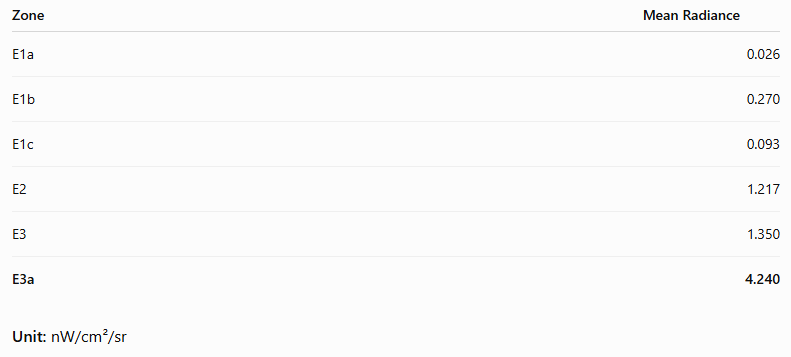
Radiance by Lighting Zone
To move beyond visual comparison, I used QGIS zonal statistics to calculate mean VIIRS nighttime radiance within each outdoor-lighting classification. The results show clear differences between regulatory zones, with E3a recording the highest mean radiance at approximately 4.24 nW/cm²/sr, compared with substantially lower values in the E1 classifications. This provides a quantitative connection between the regulatory lighting geography and satellite-observed nighttime illumination.
Protecting Southern Arizona's Night Sky
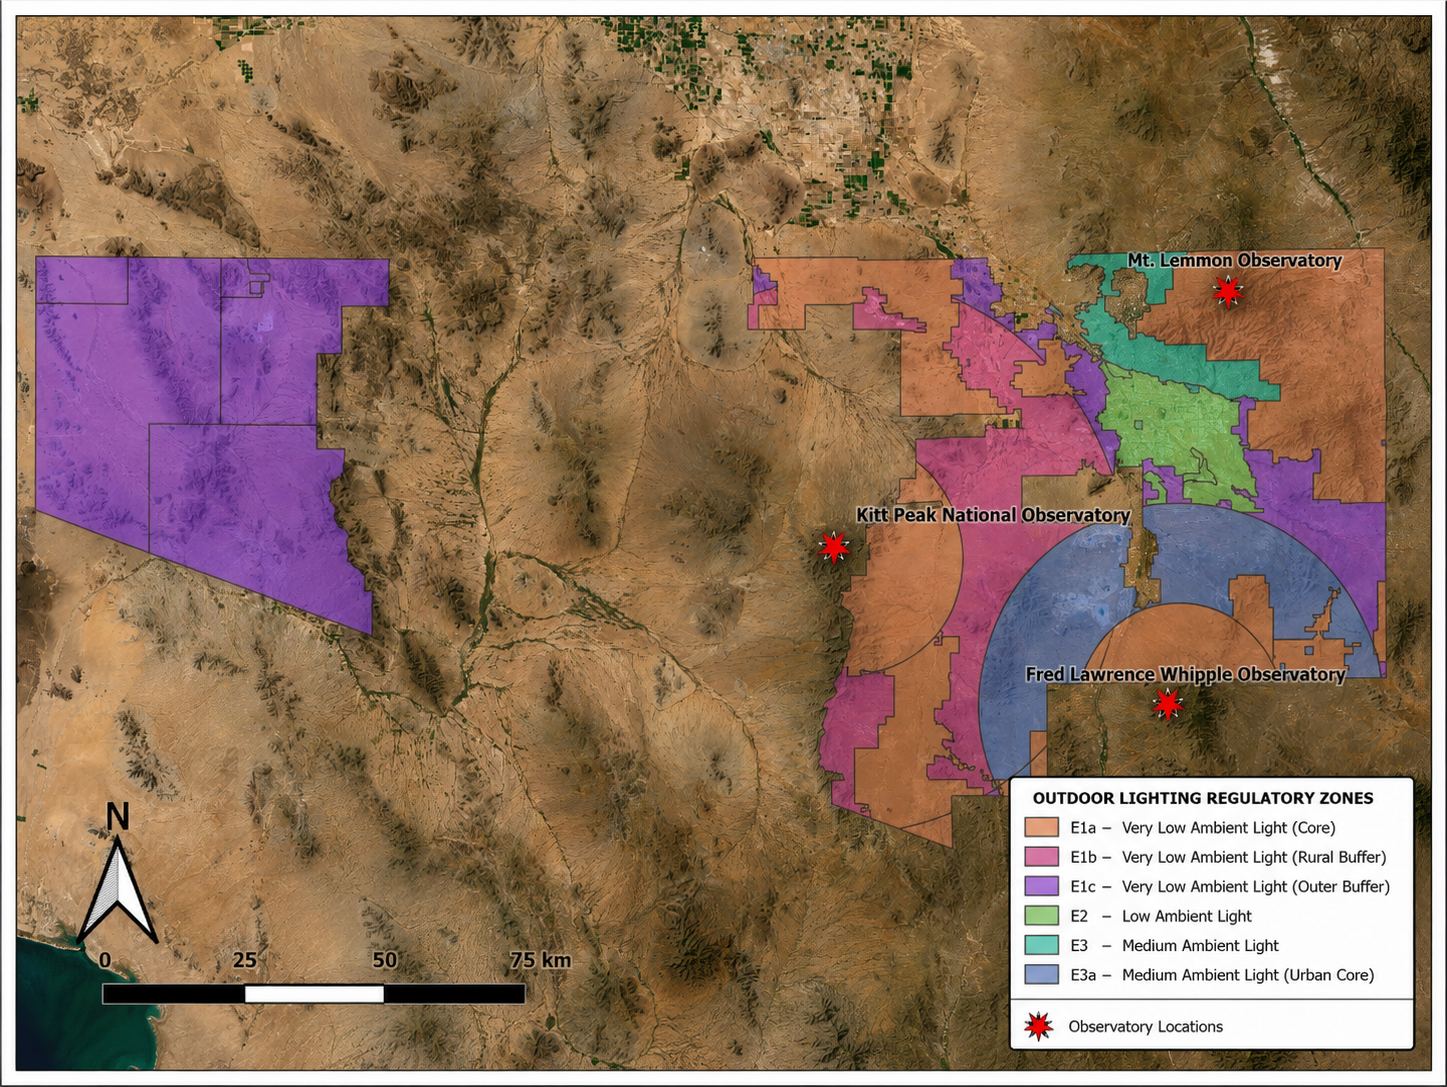
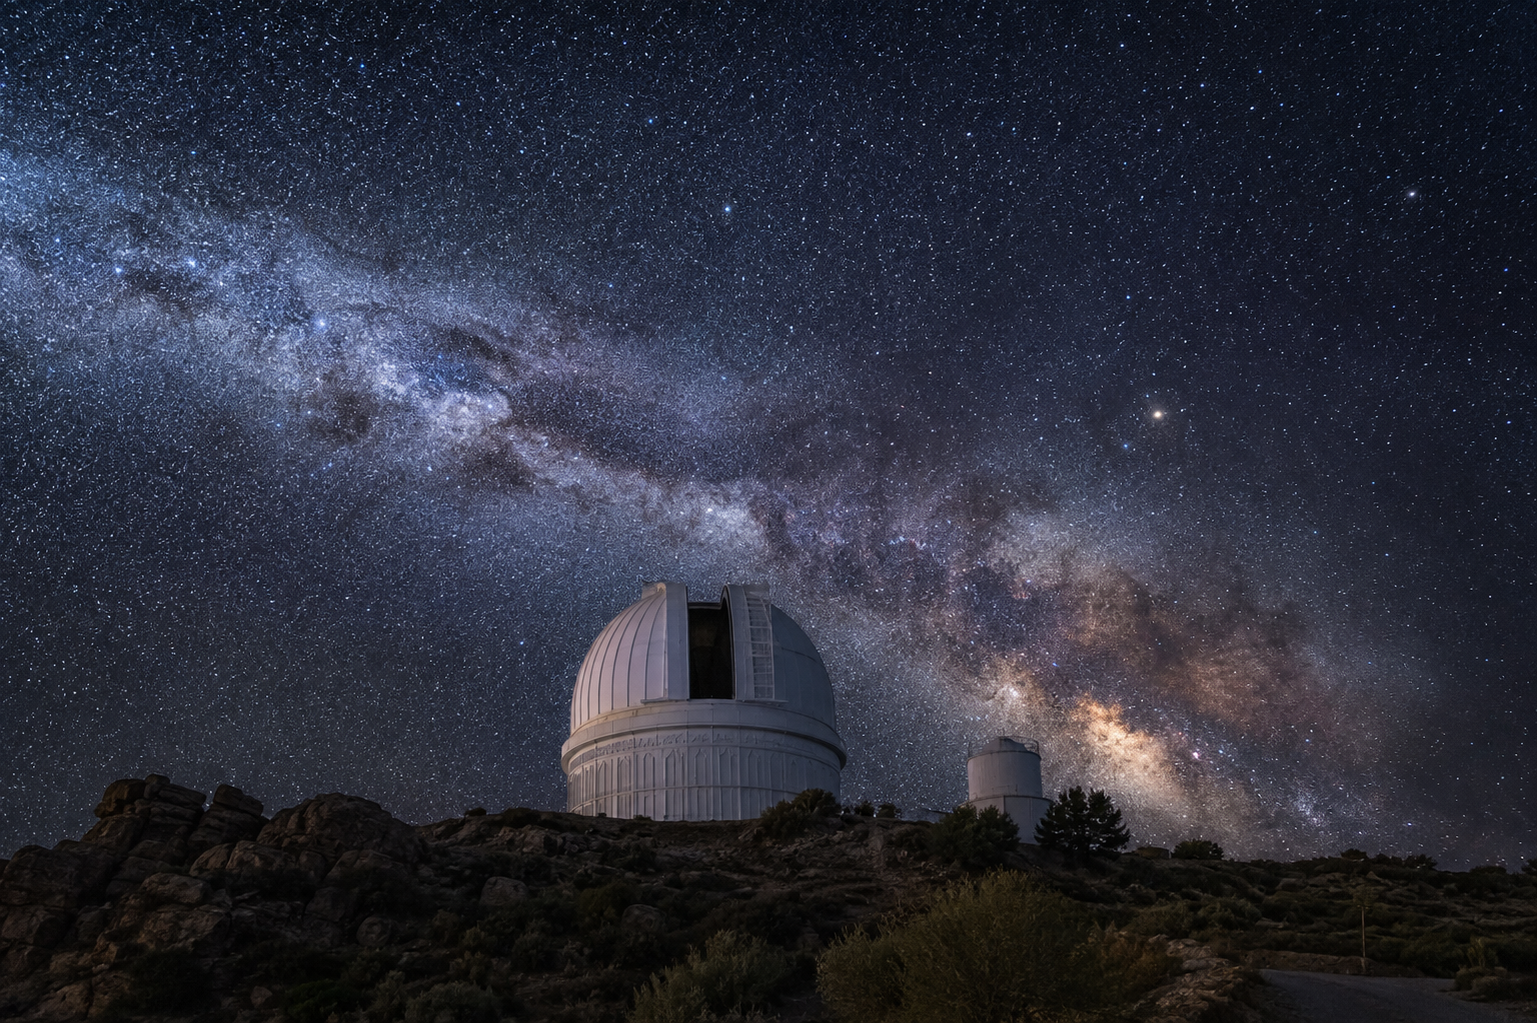
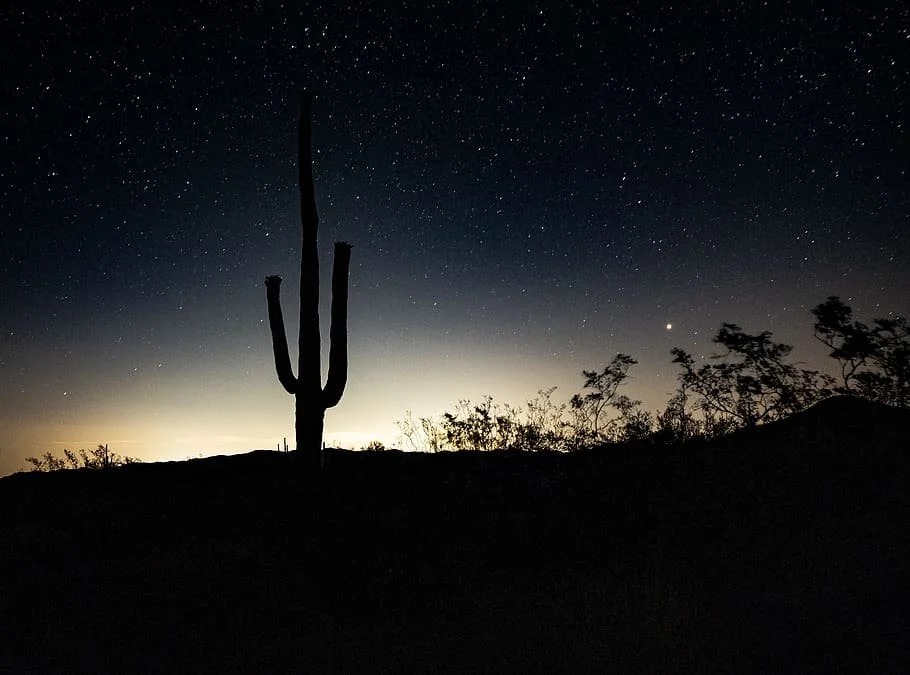
Tucson's lighting regulations exist within a much larger astronomical landscape. Major observatories surrounding the metropolitan area depend on exceptionally dark skies. Mapping observatory locations alongside VIIRS radiance helps illustrate the geographic relationship between urban development, outdoor-lighting regulation, and astronomical resources.
Although increased nighttime radiance is visible within the metropolitan area, this project does not attempt to quantify its direct effect on astronomical observations.
GIS Workflow
Pima County GIS → QGIS → Lighting-Code Classification → VIIRS 2012/2025 → Raster Processing → Zonal Statistics → Cartographic Analysis
Connected QGIS directly to Pima County's ArcGIS REST service.
Imported and classified 93 outdoor-lighting regulatory polygons.
Standardized project data within the appropriate coordinate-reference systems.
Processed VIIRS nighttime-light imagery for 2012 and 2025.
Calculated zonal statistics by LITECODE classification.
Added regional observatory locations for geographic context.
Produced static maps and an animated temporal comparison.
Tools used
QGIS 3.44 | ArcGIS REST Services | VIIRS Day/Night Band | Pima County GIS | Raster Analysis | Zonal Statistics | Cartography
View Project Files & Documentation